Heartland Intel.
The AI-infrastructure stack, read end to end. Land, grid capacity, interconnection position, capital and hiring for every corridor site. The picture that takes teams weeks to assemble, in one place, kept current.
AI gets built in the Heartland. Heartland Intel is how you read it.
AI infrastructure is one stack: the data centers and the power that feeds them, the chips and cooling inside, the fiber between, and the grid build racing to keep up. That stack is landing fastest across Ohio, Virginia and the states around them.
Most tools see one slice. Heartland Intel connects the three that decide a buildout: the demand landing, the equipment that has to feed it, and the grid in between. Announced data centers and fabs, transformer and switchgear lead times, interconnection queue and substation headroom, read as one live picture for the developers, suppliers, engineers and investors putting it in the ground.
Planned, permitted, under-construction and operating data centers, fabs, substations and generation.
Utility territories, interconnection queues, substation headroom and energization timing.
Transformer, switchgear, cooling and generator vendors, and the projects they are tied to.
Long-lead equipment needs and lead times, matched to project timing before the RFP goes public.
Developers, funds, financing events and the sponsors moving earliest in the cycle.
The trades, technicians and engineers each buildout hires, modeled against live openings.
One picture of the corridor, for everyone building it
A developer screening a parcel and a supplier timing a quote pull from the same live grid, queue and permitting data.
- 01
Developers and site selectors
Screen any site on power, queue position and tariff exposure before capital is committed.
- 02
Suppliers and OEMs
See cooling, switchgear and generation demand the moment a project moves, ahead of the RFP.
- 03
Engineers and EPCs
Scope MEP and interconnection work against verified stages and real substation headroom.
- 04
Utilities and investors
Track load growth, queue position and capital across the corridor in one view.
Six reads that decide a site
Select a site. Heartland Intel returns the grid, queue, lead-time, probability, tariff and generation reads behind the decision.
Grid headroom
Available capacity at the nearest substation, and the load a site can carry today.
Queue risk score
The site's position in the PJM interconnection queue, and its odds of clearing.
Equipment lead times
Transformers, switchgear and gensets tracked to the week, so a schedule meets the gear that gates it.
Project probability
A verification score on permits, power and capital that separates a real buildout from a press release.
Tariff exposure
Cost exposure under state data-center demand tariffs, from AEP Ohio to Dominion, modeled per site.
Behind-the-meter
On-site generation potential, gas or solar, and the scale a site can support.
The buildout, plotted on the grid that powers it
From Virginia's Data Center Alley and the Silicon Heartland out to Texas, Arizona and the West, we track the buildout across 39 states. Every site sits on the transmission network it draws from, sized by the load it needs.
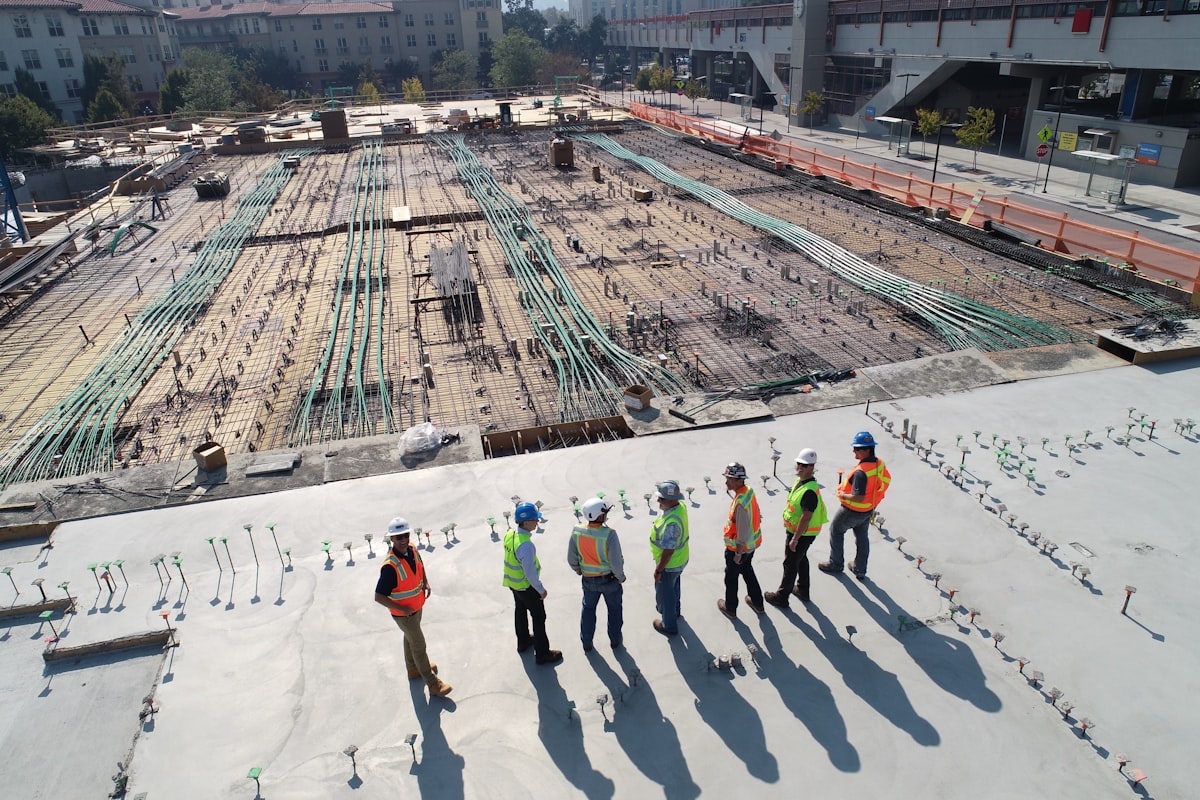
Active construction from Central Ohio to Data Center Alley
Open the terminal
The live activity feed, project tracking, procurement pipeline, workforce demand and the grid map, in one workspace. Start free; scale from Individual to Team to Enterprise with API access.